


Infrastructure
Light-Emitting Diode (LED) Traffic Signals and Traffic Flow Management SystemsMany cities have begun replacing their old incandescent halogen bulb traffic lights with much more energy efficient and durable light-emitting diode (LED) traffic lights. LED arrays in the new traffic lights include hundreds of individual LEDs each the size of a pencil eraser. There are three principle advantages to upgrading municipal traffic lights to LEDs:
Typical incandescent traffic lights use 100-watt or 150-watt bulbs that are operating 24 hours a day, utilizing more than 2.4 kilowatt-hours per day. At 8 cents per kilowatt-hour, one intersection can cost almost $600 per year in electricity. Large cities with thousands of intersections spend millions of dollars on electricity just for traffic lights. LED arrays consume 12-20 watts instead of 100, reducing overall energy consumption considerably. Portland spent $2.1 million to change out red and green traffic lights to LEDs and received a 4-year payback on the project.[1] Solar panels can power LED traffic lights in remote areas, reducing the costs of installing power lines.
Another benefit of LED traffic signals is the fact that they do not burn out all at once. When an incandescent filament burns out, the entire light ceases to function. In an LED, a single diode or a cluster of diodes can stop working or burn out, but the other diodes operating independently will continue to function normally. This feature eliminates the safety risks and traffic congestion problems of burnt-out traffic signals.
Traffic Flow Management Systems
Traffic flow management consists of set light timing, activated traffic signals, signal synchronization and more techniques that work to improve traffic flow. With these programs commuters should experience a reduction in travel time, less gas consumption and cost savings due to the coordination of signals. These strategies reduce air pollution and GHG emissions caused by idling.
High Efficiency Street Lighting
According to a review conducted by the California Energy Commission, street lighting accounts for as much as a quarter of a municipality’s electric bill.[9] The choice of what kind of street lighting to use affects the city budget as much as it influences the city’s ambience. New technologies in lighting provide more efficient ways to effectively illuminate neighborhoods and public spaces. The quality and brightness of street lighting does not need to be compromised in order to significantly reduce the amount of electricity consumed.
High Pressure Sodium LampsHigh pressure sodium lamps (HPS) are a very popular option for municipal street light systems across the country. HPS lighting is 57% more efficient than incandescent street lamps and 32% more efficient than mercury vapor lamps. HPS lamps produce 90-150 lumens per watt[10] (compared to 30-48 lumens per watt in mercury vapor lamps).[11] HPS street lighting systems have a payback period of about six years compared to mercury vapor lamps.[12] However, the orange-yellow light produced by HPS lamps does not contain light in the blue spectrum, diminishing people’s ability to use peripheral vision at night. It also does not render colors as well as other lamp types.
Low Pressure Sodium LampsLow pressure sodium lamps (LPS) are even more energy efficient than HPS lamps. They were designed to operate at low temperatures and maintain luminance throughout the lamps’ lifetime. The light produced by LPS lamps is a dull yellow color, does not allow for effective peripheral vision, and does not render colors well. It is the lighting of choice around observatories since the monochromatic light can be filtered by telescopes. LPS color limitations make it difficult to use. Therefore, the intensity of sodium lamp lighting levels may need to be adjusted to perform as well as lower wattage, wider spectrum white lighting.
Metal Halide LampsMetal halide lamps use an electric current that passes through a gas to create light. The bright white light is very effective for rendering colors at night and does not adversely affect peripheral vision. Metal halide lamps produce large amounts of heat and can burn out quickly. The brightness of the lamps also creates a high potential for glare. Metal halide lamps are twice as energy efficient as the mercury vapor lamps they replace. Metal halides require 60-100 lumens per watt and last on average 10,000-15,000 hours.[13]
Induction
Lighting[14]
Table: The Pros and Cons of Lamp Options [15] |

High Efficiency Street Lighting |
CASE STUDY: Medford, MA |
The city of Medford has approximately 4,600 streetlights. Although the local electricity utility owns the majority of the streetlights, the city pays the electricity bill. It has worked closely in conjunction with Massachusetts Electric to convert all of the city’s old mercury vapor lamps to HPS lamps. [20] According to the city of Medford’s Climate Action Plan,[21] the city expects to save nearly $20,000 annually on its electricity bill and will reduce its CO2 emissions by 148 tons.
CONTACTEnvironmental AgentPatricia L. BarryDepartment of Energy & Environment Office(781) 393-2137[email protected] |
High Efficiency Street Lighting |
CASE STUDY: Flagstaff, AZ |
|
More city of Flagstaff’s street lights are low-pressure sodium lamps. Municipal regulations that limit the total number of lumens per acre have encouraged the conversion of the city’s streetlights to LPS. Many citizens of Flagstaff comment[22] [23]
on the positive effects that the lower light levels have on stargazing. The Flagstaff Police Department does not believe that the lower light levels have caused a negative effect on witness or vehicle identification for crime investigations.[24]
CONTACT
Chris MonteverdeTransportation Department(928) 774-1605[email protected] |
High Efficiency Street Lighting |
CASE STUDY: San Diego, CA |
The Gaslamp Quarter in San Diego is a busy pedestrian area with many shops, restaurants and outdoor events. The city of San Diego retrofitted 179 HPS light fixtures with induction lighting in the 16-block Gaslamp Quarter to enhance the ambience and safety of the night-time environment. The city saves approximately $12,700 a year in maintenance and energy savings from the retrofit. Over the lifetime of the induction lighting system, the lamps of the HPS system would have had to be replaced about four times. The induction lamp is also brighter than an HPS lamp of the same wattage. Although the HPS lamps are more efficient in lumens per watt, the city saves energy by utilizing a lower wattage induction lamp. The induction lamp system has been praised by San Diego residents for the whiter and fuller light it produces.[25]
CONTACT
Jim TociEngineering and Development Department(619) 527-8087 |
Increase Efficiency of Municipal Water and Wastewater Utilities
About 3% of the nation’s electricity supply is consumed by water and wastewater utilities.[26] Water and wastewater systems spend about $4 billion a year on energy to pump, treat, deliver, collect and clean water.[27] This cost can account for as much as one-third of a municipality’s total electricity bill.
Many systems operate at less than optimal efficiency. Causes of inefficiency in a water or wastewater system include:
Incorrectly selected and inefficient pumps
Limited capacity in transmission and distribution systems
Lack of automatic or remote control of pumps/ valves
Buying power at peak price times
Operator error
The Environmental Protection Agency (EPA) ENERGY STARÒ program has recently expanded its industrial component to include an evaluation of water and wastewater energy performance.[28] The new program estimates that a 10% reduction in energy use at publicly-owned water and wastewater utilities through cost-effective investments and technology upgrades can save 5 billion kWh of electricity and over $400 million annually. The upgrades can also result in a significant reduction of total water consumption.
The primary objectives of a municipal water/wastewater system are to supply the water demanded by the public and maintain water quality while minimizing capital costs. Small publicly-owned utilities may believe that they cannot justify a significant investment to reduce the energy costs for a water/wastewater system if the total energy costs are relatively small. However, many efficiency upgrades can provide significant cost savings with a relatively small capital investment.
Large utilities can achieve significant cost savings with a whole-system approach to identifying sources of inefficiencies in their pumping systems.[29] Life cycle cost analysis can provide insight into the total returns on investment a utility can expect from a more efficient system.
The best way to identify significant cost saving opportunities within a water/ wastewater system is to perform an audit. Audits identify the different areas where inefficiencies exist and present costs of implementation and potential savings. Many private energy consulting companies provide such specialized energy audits.
The best bets for
significant energy savings in water/wastewater facilities include:
[30]
Manage demand to avoid
peak electric rate periods
Modify or replace
inefficient pumps
Install energy efficient
motors
Control pump speed and
flow electronically with variable frequency drives
Install efficient
lighting
Implement training
programs to reduce worker error
Manage demand to avoid peak electric rate periods
Modify or replace inefficient pumps
Install energy efficient motors
Control pump speed and flow electronically with variable frequency drives
Install efficient lighting
Implement training programs to reduce worker error
The use of renewable energy or fuel cells for power can also increase efficiency, although the initial costs are greater than the other measures listed above.[31]
Utilities can reduce the total electricity needed to provide the required services, including replacement of inefficient pumps and motors or minimize the flow rates of water and wastewater on the consumer side through educational campaigns and strategic pricing. Any municipal policy that aims to increase the overall efficiency of a water/wastewater utility should include a combination of both.
Water and Wastewater Efficiency |
CASE STUDY: Columbus, GA |
The city of Columbus, Georgia has saved over $1 million in energy costs over the past five years by overhauling its water utility.[32] The Columbus Water Works is a municipally-owned water and wastewater utility that provides services to the community of 186,000 people. An analysis performed by the Water Works identified energy costs as the utility’s largest single expenditure. Through a process of reengineering and retrofitting old equipment, the city increased the water system’s energy efficiency and cut energy costs significantly.
The retrofit included many different elements. The entire wastewater and drinking water treatment system was reengineered to be fully automated. Old motors throughout the system were replaced with more energy efficient models. Automated motor operators retrofitted onto the system’s compressed air blowers reduced the utility’s energy costs by 25%, with less than a one year payback.[33] An energy consultant evaluates the utility’s energy use every quarter and recommends improvements.
Employees are encouraged to make recommendations for efficiency improvement projects. Managers and team leaders attend biannual trainings on energy efficiency.
CONTACT
Senior Vice President of OperationsCliff ArnettColumbus Water Works(706) 649-3458
[email protected] |
Water and Wastewater Efficiency |
CASE STUDY: Fairfield, OH |
|
Fairfield Wastewater Treatment Facility in Ohio provides services to 45,000 people. Since 1986, the utility has increased the energy efficiency of its operations through an automated system and continuous technology upgrades.In 1999 the Wastewater Division implemented a real-time rate-pricing program using data from previous years to calculate an energy usage baseline. When electricity prices peak, the facility uses its automated system to shut down temporarily and save money. This system has shifted 35–40% of peak loads to cheaper, off-peak periods, resulting in energy bill reductions of up to 17%.[34] Continuous monitoring of the system’s operations and energy use allow the utility to maintain optimal performance.
Fairfield’s utility management uses a general set of guidelines to facilitate investment decisions in energy efficiency upgrades. The Fairfield Wastewater policy states that efficiency upgrades that cost less than $15,000 and have a payback of less than five years receive automatic authorization. This process gives project managers much more flexibility in including such upgrades in their annual budgets.
There is a 21-member team composed of operations staff members that meets regularly to discuss new technology and energy efficiency ideas. Fairfield Wastewater also encourages feedback and input from staff at weekly operations meetings.
CONTACT
Drew YoungFairfield Wastewater Treatment Facility
(513) 867-5369
|
Water and Wastewater Efficiency |
CASE STUDY: Austin, TX |
The city of Austin Water and Wastewater Utility provides services to over 600,000 people. The semiarid climate of Central Texas requires the city of Austin to manage its water resources wisely. The hilly terrain places a heavy demand on the utility’s pumping system.
To reduce the overall energy use of pumping water through the transmission and distribution system, members from several departments meet regularly to share ideas for improving the efficiency of the utility’s pumping system. The ad-hoc committee has implemented measures to upgrade the system’s pumps to more efficient models and to limit pumping to off peak hours.
The Austin Water and Wastewater Utility interfaces with the largest water consumers in the residential, commercial, and industrial sectors. The utility continuously monitors energy use and water flow through a series of submeters throughout the distribution system. This information allows the utility to coordinate repairs and upgrades more efficiently. Austin reports a rate of total water loss through its distribution system of only 8%.[35]
|
|
Water and Wastewater Efficiency |
CASE STUDY: San Diego, CA |
The city of San Diego faces a growing demand for water and an increasingly tight supply. It has the unenviable task of maintaining services while minimizing total water consumption due to increased political pressure from other water-deficient cities and states. The daily volume of wastewater transported and treated in the MWWD facilities requires a considerable amount of electrical and thermal power. Pumps, lights, computers, mechanical valves and machinery consume electricity. Thermal energy, usually generated by electrical power or by burning natural gas, provides heat and cooling necessary for both buildings and the wastewater treatment process. It is in the best interest of the city of San Diego and its residents to maximize the potential of their scarce resources by minimizing the energy and water used to provide necessary services.
The San Diego Metropolitan Wastewater Department (MWWD) established a multi-year strategic plan to mitigate the risk of future energy shortages in California. One of the city’s goals is to reduce the energy consumed at wastewater facilities by at least 7%. The MWWD has created an Energy Efficiency Program to achieve this goal.The MWWD Energy Efficiency Program targets cost-effective ways to achieve water and energy savings in the following areas:
The energy savings made by the MWWD and the Energy Efficiency Program maintain lower sewer rates and reduce the risk of rolling electrical blackouts due to excessive peak energy demand.
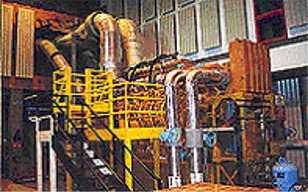
Point Loma Wastewater Treatment Plant[37]
Digesters at the Point Loma Wastewater Treatment Plant use heat and bacteria to break down the organic solids removed from wastewater. One of the by-products of this biological process is methane gas, a potent greenhouse gas that can also be used to generate electricity. The gas emitted from waste is approximately 60% to 65% methane, also known as digester gas (DG).
Image: Point Loma Wastewater Treatment [38]
MWWD has installed such cogeneration systems in several of its plants. During fiscal year 2000, one wastewater plant saved the city of San Diego more than $500,000 in energy costs and earned an additional $400,000 from selling excess power back to the grid.[39]
California government grants make cogeneration projects more cost-effective. Current grants are approximately $1,000/kW for reciprocating internal combustion (IC) engines, $1,300/kW for microturbines, and $4,500/kW for fuel cells on renewable fuels like digester gas and landfill gas.
The city of San Diego complements its energy efficiency upgrades with an aggressive demand-side management policy to minimize the total water consumed by the city. Consumers receive information on how to minimize water consumption. San Diego also treats and reuses wastewater. One of the city’s reclamation plants treats up to 30 million gallons of wastewater every day. MWWD sells the reclaimed water at a reduced price to customers for use in landscaping, irrigation, industrial, and agricultural purposes. Pipelines and equipment used in the reclaimed water process are specially marked or color coded to differentiate them from drinking water pipes. MWWD also uses a flow metering alarm system to minimize undetected sewage spills.
CONTACTPublic Information OfficerMichael Scahill, San Diego MWWD[40](858) 292 6415
Chair of Energy CommitteeJesse Pagliaro(619) 221 8728[email protected] |
Landfill Gas-to-Energy Projects
As trash decomposes, it produces methane gas, a GHG that traps more than 21 times more heat per molecule than CO2.[41] Municipal solid waste landfills account for more than a third of human-related methane emissions in the United States.[42] Methane gas comprises about one-half of the volume of landfill gas. The other half of the gas is a mixture of CO2, other gases and traces of organic compounds.
Landfill gas is recovered using a system of wells and either a blower/flare system or a vacuum system. The gas is pumped to a central collector where it is converted into the appropriate form depending on what its ultimate use will be. Methane can be used to fuel vehicles, supply industrial operations, power an electricity generator or can even be upgraded to higher-quality methane gas for distribution via pipeline. To generate electricity from landfill gas, the methane from the landfill gas is used to power internal combustion engines or turbines. Other technologies for producing electricity from landfill gas are currently under development and may increase the overall efficiency of the process. This process reduces municipal energy costs by providing a low-cost alternative to conventional fossil fuels. Landfill gas that leaks is a wasted economic opportunity.
Capture and use of landfill methane also reduces bad odors and health hazards. A study in the State of New York found that women living near 38 landfills with landfill gas leaking into the surrounding environment have a four-fold increased chance of bladder cancer or leukemia.[43] As with all waste issues, an essential element of the solution to the problem of landfill gas emissions is reducing the quantity of waste generated.
According to the EPA, there are more than 395 landfill gas capture projects in the country and nearly 600 municipal landfills that could qualify for a methane capture retrofit.[44] The potential for electricity production at the remaining landfills would be sufficient to provide power to 900,000 homes.[45]
Since 1979, federal regulations promulgated under Subtitle D of the Resource Conservation and Recovery Act (RCRA)[46]—which regulates the design and operation of municipal solid waste landfills—have required controls on migration of landfill gas. The regulations require methane monitoring and establish standards for methane migration control. Monitoring requirements apply to a landfill during operation and for a period of 30 years after closure. Landfills affected by RCRA Subtitle D must control gas by establishing a program to periodically check for methane emissions and prevent off-site migration. Gas-to-energy projects facilitate the achievement of these standards by minimizing the quantity of gas underground and by providing a cash flow in the form of energy to offset the upfront costs of the gas recovery infrastructure.
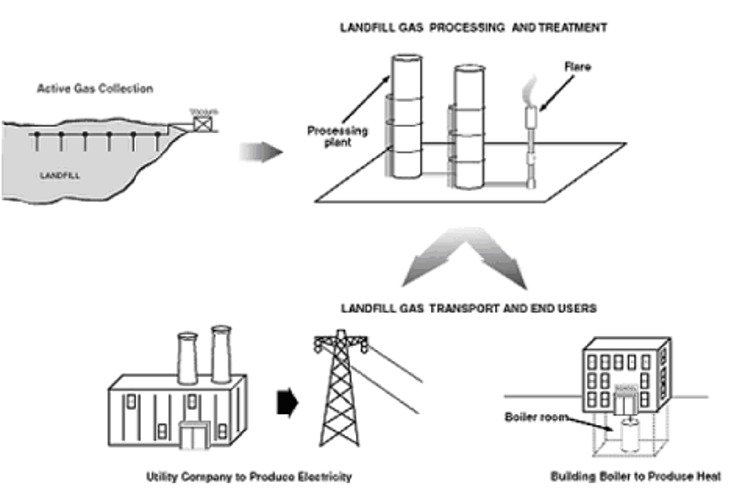
Image courtesy of EPA[47]
Landfill gas can also be used directly in several industrial processes including the operation of boilers, kilns and greenhouses. Most processes that use natural gas or require quantities of heat can substitute the use of landfill gas. The EPA lists the following industries that used landfill gas in their manufacturing and/or industrial processes:
Auto manufacturing
Chemical production
Food processing
Pharmaceuticals
Cement and brick manufacturing
Wastewater treatment
Consumer electronics and products
Paper and steel production
Some landfill gas recovery projects utilize cogeneration to increase the overall efficiency of the recovery and reuse process. The thermal energy produced as part of the electricity generation process can be stored in the form of steam or hot water and used for heating, cooling or other applications.
Landfill gas recovery and
reuse:
Reduces emissions of a
potent greenhouse gas
Offsets use of
non-renewable sources of energy (natural gas, coal, oil)
Provides low-cost source
of electricity
Minimizes odors emitted
from landfills
Eliminates health risks
associated with organic compounds in landfill gas
Reduces risk of explosion
from built-up methane gas pockets
Benefits local economy
Reduces cost of
compliance with local, state and federal air quality regulations
Landfill Gas to Energy Projects
CASE STUDY: Los Angeles, CA
The Sanitation Districts of Los Angeles County
(Districts) began recovering the estimated 26,000 cubic feet per minute
(cfm) of landfill gas generated at Puente Hills Landfill, the largest
landfill in the nation, in the 1980’s.[48]
The intent of the landfill gas collection project was to minimize
landfill gas emissions to the atmosphere and limit below-ground
migration of the gas in accordance with federal regulations. The
Districts originally used the landfill gas to fuel an electricity
production facility that has been operating at the site since January of
1987. After noticing that a percentage of the gas was not being
utilized and had to be flared, the Districts decided to begin converting
that gas to vehicle fuel.
In October of 1993, the Districts opened the country’s
first facility to convert landfill gas to vehicle fuel. Wells inserted
deep into the landfill capture the gas and transport it to a processing
facility where it is purified through membranes to remove CO2 and water
vapor. The resulting compressed natural gas (CNG) is used as a fuel for
landfill equipment, garbage trucks, water trucks and employee rideshare
vans.
Landfill gas from Puente Hills is also transported to the
Districts' Joint Administrative Office where it is used for heating and
cooling. The Districts also sell a portion of the gas to Rio Hondo College for
heating school facilities and for powering a CNG vehicle.
The Puente Hills gas-to-energy facility produces enough CNG
fuel for a fleet of 11 vehicles and produces about 50 megawatts of
power, enough to provide electricity to 70,000 homes. The Districts
operate two smaller gas-to-energy facilities, Palos Verdes (6 MW) and
Spadra (8.5 MW). Since the capital costs of all three facilities have
already been recuperated, the Districts only pay for maintenance and
operation costs of the facilities. This amount is more than offset by
the sale of electricity to local utilities. In 1997, electricity sold
from the Puente Hills facility alone amounted to $16.5 million in net
revenues.[49]
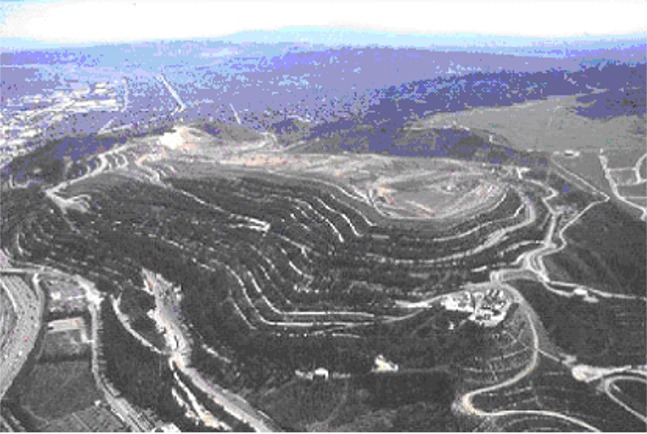
Puente
Hills Landfill: Image
courtesy of Los Angeles County Sanitation District[50]
The project prevents the release of large quantities of
landfill gas to the atmosphere and helps minimize the accumulation of
nitrogen oxides (NOx) that contribute to the formation of smog. With
greenhouse gases now being regulated in California, the project
may potentially minimize the regulatory costs of compliance that other
landfills without gas recovery mechanisms may face.
CONTACT
Sanitation Districts of
Los Angeles County
Solid Waste Management Department
(562) 908-4288, extension 2428
Landfill Gas to Energy Projects
CASE STUDY: Riverview, MI
The city of Riverview, Michigan,
owns and operates the Riverview Land Preserve landfill in Wayne County.
In a joint project with the local utility, Detroit Edison, the city
recovers and sells landfill gas to generate energy. The partnership
began in 1987 with the development of a landfill gas-to-energy project
on the 212-acre landfill. A subsidiary of Detroit Edison collects the
gas and sells it to Riverview Energy Systems, where it generates
electricity in two gas turbines. Detroit Edison then purchases the
electricity under a 25-year power purchase agreement. The gas-to-energy
project provides enough electricity for 3,700 homes.
The city has achieved attainment of federal methane gas
migration requirements at its landfill in a cost-effective way. The
project provides revenue directly to the city as stipulated in the terms
of the contract. Since the installation of the project facilities,
property values surrounding the landfill have increased and new
neighborhoods have been constructed. The so-called “Mount
Trashmore” that was once an eyesore and a safety hazard has also been
turned into a wintertime skiing and recreation area.
The Riverview gas-to-energy project is a good example of
local governments and local industries collaborating to achieve positive
results. Detroit Edison not only receives a locally produced and
inexpensive source of electricity, but also the positive publicity that
this project continues to generate.[51]
CONTACT
Director
Bob Bobeck
Riverview Land Preserve
(734) 281-4263
[email protected]
Landfill to Gas Energy Projects
CASE STUDY: Orange County, FL
Orange County's landfill gas-to-energy system collects gas from the 200
acres of waste at the Orange County landfill. The gas is piped to the
Stanton Energy Center where it is used to fuel a generator. The
landfill produces an estimated 6,000 cfm of gas, enough fuel to generate
electricity for 13,000 homes.[52]
The Orange County Solid Waste Department sold the landfill
project to DTE Biomass which will own and operate the landfill gas recovery project
over the term of a 20-year contract with Orange County. The
project received $4 million in federal funding and also benefits
from multiple tax incentives.
Orange County recuperated its initial costs with the sale of the project
for $5 million and will earn an estimated $400,000 annually on the
landfill gas rights. The project reduces methane emissions by 31,000
tons per year.
The Orange County Solid Waste Department worked closely
with the EPA’s Landfill Methane Outreach Program (LMOP) in the
development of this project. The LMOP provides information on technologies to help optimize
efficiency and production while minimizing the costs of the gas recovery
system. They work with several municipalities across the country in the
design and implementation of landfill gas-to-energy projects. Orange County received
recognition from the EPA as the 1998 Partner of the Year.
CONTACT
Orange County Solid Waste Department
[email protected]
Additional Resources
Reduces emissions of a potent greenhouse gas
Offsets use of non-renewable sources of energy (natural gas, coal, oil)
Provides low-cost source of electricity
Minimizes odors emitted from landfills
Eliminates health risks associated with organic compounds in landfill gas
Reduces risk of explosion from built-up methane gas pockets
Benefits local economy
Reduces cost of compliance with local, state and federal air quality regulations
Landfill Gas to Energy Projects |
CASE STUDY: Los Angeles, CA |
|
The Sanitation Districts of Los Angeles County (Districts) began recovering the estimated 26,000 cubic feet per minute (cfm) of landfill gas generated at Puente Hills Landfill, the largest landfill in the nation, in the 1980’s.[48] The intent of the landfill gas collection project was to minimize landfill gas emissions to the atmosphere and limit below-ground migration of the gas in accordance with federal regulations. The Districts originally used the landfill gas to fuel an electricity production facility that has been operating at the site since January of 1987. After noticing that a percentage of the gas was not being utilized and had to be flared, the Districts decided to begin converting that gas to vehicle fuel.
In October of 1993, the Districts opened the country’s first facility to convert landfill gas to vehicle fuel. Wells inserted deep into the landfill capture the gas and transport it to a processing facility where it is purified through membranes to remove CO2 and water vapor. The resulting compressed natural gas (CNG) is used as a fuel for landfill equipment, garbage trucks, water trucks and employee rideshare vans.
Landfill gas from Puente Hills is also transported to the Districts' Joint Administrative Office where it is used for heating and cooling. The Districts also sell a portion of the gas to Rio Hondo College for heating school facilities and for powering a CNG vehicle.
The Puente Hills gas-to-energy facility produces enough CNG fuel for a fleet of 11 vehicles and produces about 50 megawatts of power, enough to provide electricity to 70,000 homes. The Districts operate two smaller gas-to-energy facilities, Palos Verdes (6 MW) and Spadra (8.5 MW). Since the capital costs of all three facilities have already been recuperated, the Districts only pay for maintenance and operation costs of the facilities. This amount is more than offset by the sale of electricity to local utilities. In 1997, electricity sold from the Puente Hills facility alone amounted to $16.5 million in net revenues.[49]
Puente Hills Landfill: Image courtesy of Los Angeles County Sanitation District[50]
The project prevents the release of large quantities of landfill gas to the atmosphere and helps minimize the accumulation of nitrogen oxides (NOx) that contribute to the formation of smog. With greenhouse gases now being regulated in California, the project may potentially minimize the regulatory costs of compliance that other landfills without gas recovery mechanisms may face.
CONTACT
Sanitation Districts of Los Angeles CountySolid Waste Management Department(562) 908-4288, extension 2428 |
Landfill Gas to Energy Projects |
CASE STUDY: Riverview, MI |
The city of Riverview, Michigan, owns and operates the Riverview Land Preserve landfill in Wayne County. In a joint project with the local utility, Detroit Edison, the city recovers and sells landfill gas to generate energy. The partnership began in 1987 with the development of a landfill gas-to-energy project on the 212-acre landfill. A subsidiary of Detroit Edison collects the gas and sells it to Riverview Energy Systems, where it generates electricity in two gas turbines. Detroit Edison then purchases the electricity under a 25-year power purchase agreement. The gas-to-energy project provides enough electricity for 3,700 homes.
The city has achieved attainment of federal methane gas migration requirements at its landfill in a cost-effective way. The project provides revenue directly to the city as stipulated in the terms of the contract. Since the installation of the project facilities, property values surrounding the landfill have increased and new neighborhoods have been constructed. The so-called “Mount Trashmore” that was once an eyesore and a safety hazard has also been turned into a wintertime skiing and recreation area.
The Riverview gas-to-energy project is a good example of local governments and local industries collaborating to achieve positive results. Detroit Edison not only receives a locally produced and inexpensive source of electricity, but also the positive publicity that this project continues to generate.[51]
CONTACT
DirectorBob BobeckRiverview Land Preserve(734) 281-4263
[email protected] |
Landfill to Gas Energy Projects |
CASE STUDY: Orange County, FL |
Orange County's landfill gas-to-energy system collects gas from the 200 acres of waste at the Orange County landfill. The gas is piped to the Stanton Energy Center where it is used to fuel a generator. The landfill produces an estimated 6,000 cfm of gas, enough fuel to generate electricity for 13,000 homes.[52]
The Orange County Solid Waste Department sold the landfill project to DTE Biomass which will own and operate the landfill gas recovery project over the term of a 20-year contract with Orange County. The project received $4 million in federal funding and also benefits from multiple tax incentives.
Orange County recuperated its initial costs with the sale of the project for $5 million and will earn an estimated $400,000 annually on the landfill gas rights. The project reduces methane emissions by 31,000 tons per year.
The Orange County Solid Waste Department worked closely with the EPA’s Landfill Methane Outreach Program (LMOP) in the development of this project. The LMOP provides information on technologies to help optimize efficiency and production while minimizing the costs of the gas recovery system. They work with several municipalities across the country in the design and implementation of landfill gas-to-energy projects. Orange County received recognition from the EPA as the 1998 Partner of the Year.
CONTACT
Orange County Solid Waste Department
[email protected]
|
LED and Traffic Flow Management:
Margaret Suozzo, A Market Transformation Opportunity Assessment for LED Traffic Signals, April 1998
www.cee1.org/gov/led/led-ace3/ace3led.pdf#search=%22berkeley%20led%20traffic%20lights%20pacific%20gas%22Optimizing Traffic Light timing through simulations
www.informs-cs.org/wsc04papers/188.pdfDallas Light timing program to improve air quality
www.dallascityhall.com/pdf/pio/CooperativeProgram.pdfU.S. Climate Change Technology Program
www.climatetechnology.gov/library/2005/tech-options/tor2005-114.pdfCalifornia Energy Commission LED Replacement Program (Has list of project costs for many California cities)
www.energy.ca.gov/releases/2002_releases/2002-03-14_led_signals.htmlState of Illinois LED Traffic Signal Rebate Program Application www.illinoiscleanenergy.org/images/ICEFC_PDFs/2006%20LED%20Application%20Fill-in.pdf#search=%22chicago%20LED%20traffic%20%22
Seattle Department of Transportation Traffic Signal Optimization Program
www.seattle.gov/transportation/signaloptimization.htmInstitute of Transportation Engineers, Traffic Signal Timing
www.ite.org/signal/optimization.asp
Efficient Streetlights
Lincoln, NE street lighting policies www.ci.lincoln.ne.us/City/attorn/designs/ds230.pdf
Low Pressure Sodium Lighting
www.nofs.navy.mil/about_NOFS/staff/cbl/LPSnet/LPS-references.htmlIssues and Facts about Lighting Rates for Palo Alto
www.cpau.com/docs/rates/ratespdf/E14-070105.pdfInternational Dark-Sky Association
www.darksky.orgThe Local Government Commission (LGC) is a nonprofit, nonpartisan, membership organization that provides inspiration, technical assistance, and networking to local elected officials and other dedicated community leaders who are working to create healthy, walkable, and resource-efficient communities.
www.lgc.org/index.html
Efficient Water and Wastewater Utilities
Consortium for Energy Efficiency (CEE) Resources Page
www.cee1.org/ind/mot-sys/ww/cr.php3EPA Wastewater Management Fact Sheet
www.epa.gov/owm/mtb/energycon_fasht_final.pdfWatergy
www.watergy.orgAlliance to Save Energy
www.ase.orgU.S. Department of Energy, Office of Industrial Technology
www1.eere.energy.gov/industry/Office of Industrial Technology Software Tools
www1.eere.energy.gov/industry/bestpractices/software.htmlWisconsin Wastewater Operator’s Association
www.wwoa.orgKing County Fuel Cell Demonstration Project
dnr.metrokc.gov/wtd/fuelcell/World Health Organization (WHO)-Regional Centre for Environmental Health Activities
www.emro.who.int/ceha/clearingh_waterdemand/portals/wutiliz/index.asp“Major Sources of Efficiency Savings”, Future Investment in Drinking Water and Wastewater Infrastructure, November 2002.
www.cbo.gov/showdoc.cfm?index=3983&sequence=6“Motor System Efficiency in Water and Wastewater Systems: A Call to Action”, American Council for an Energy-Efficient Economy, 2002.
www.cee1.org/ind/mot-sys/ww/call.pdfGreen Pages – Service Providers for Municipal Wastewater Treatment Systems
www.eco-web.com/index/category/2.2.htmlLawrence Berkeley National Laboratory Water and Energy Technology Team
water-energy.lbl.gov/index.php?wastewaterWater Conservation Program in Mountain View, CA
The city of Mountain View, California has a very comprehensive water conservation program to provide resources and incentives to both commercial and residential customers. For information on the program, visit:
www.ci.mtnview.ca.us/living/water_conservation.htmNorthwest Energy Efficiency Alliance Case Studies
Ellensburg Wastewater Treatment Plant[53]
Kennewick Wastewater Treatment Plant[54]DMOZ Water Utility Open Directory of Companies
dmoz.org/Business/Energy_and_Environment/Utilities/Water/City of San Diego Metropolitan Wastewater Energy Efficiency Program
www.sandiego.gov/mwwd/initiatives/energy.shtmlWater and Wastewater International Publication Article on Cogeneration for Municipal Wastewater
ww.pennnet.com/Articles/Article_Display.cfm?Section=ARTCL&ARTICLE_ID=254314&VERSION_NUM=2&p=20Anaerobic Digester Methane to Energy A Statewide Assessment, 2003, Prepared for Focus on Energy
www.focusonenergy.com/data/common/pageBuilderFiles/Anaerobic_Report.pdf
Landfill Gas to Energy:
EPA Landfill Methane Outreach Program
www.epa.gov/lmop/Landfill Gas Control Measures
U.S. Department of Health and Human Services
Agency for Toxic Substances and Disease Registry
www.atsdr.cdc.gov/HAC/landfill/PDFs/Landfill_2001_ch5.pdf#search=%22riverview%20michigan%20landfill%20gas%22EPA LMOP Database of Participating Municipalities
www.epa.gov/lmop/proj/xls/lmopdatami.xlsMore Case Studies
www.epa.gov/lmop/res/index.htm#4